1. Introduction & Overview
What are Prometheus Exporters?
Prometheus Exporters are software components that collect metrics from systems, services, or applications and expose them in a format Prometheus understands. Exporters bridge the gap between Prometheus and systems that don’t natively expose metrics in Prometheus’ pull-based model.
In RobotOps (Robot Operations), exporters play a vital role in collecting telemetry, hardware metrics, communication data, and application-level statistics from robotic systems.
History or Background
- Prometheus was created at SoundCloud in 2012 and later donated to the CNCF in 2016.
- As Prometheus adoption grew, the need to monitor systems without native Prometheus instrumentation emerged. Exporters were born as adapters.
- Today, exporters exist for databases, hardware, IoT devices, network gear, and robots.
Why is it Relevant in RobotOps?
Robots consist of multiple moving parts—sensors, actuators, CPUs, GPUs, edge devices, and communication protocols. Monitoring is critical because:
- Early anomaly detection prevents robotic failures.
- Exporters enable seamless integration of robot telemetry into Prometheus and visualization tools like Grafana.
- Ensures predictive maintenance, real-time monitoring, and performance optimization.
2. Core Concepts & Terminology
Key Terms
| Term | Definition |
|---|---|
| Prometheus | Open-source monitoring system and time-series database. |
| Exporter | Component that collects metrics and exposes them in Prometheus format. |
| Metrics Endpoint | HTTP endpoint (/metrics) where metrics are exposed. |
| Scraping | Process of Prometheus pulling metrics from exporters at regular intervals. |
| Labels | Key-value pairs used to filter and organize metrics. |
| RobotOps | Framework and practice of managing robotic systems with DevOps-like tools. |
How it fits into the RobotOps Lifecycle
- Development Phase: Developers instrument robot applications using Prometheus clients or exporters.
- Deployment Phase: Exporters run alongside robotic control systems, exposing telemetry.
- Operations Phase: Prometheus scrapes exporters, Grafana visualizes metrics, alerts trigger incident response.
3. Architecture & How It Works
Components
- Prometheus Server – Central collector and time-series DB.
- Exporters – Bridge systems (robot sensors, motors, cameras) with Prometheus.
- Service Discovery – Finds exporters running on robots.
- Grafana/Alertmanager – Visualizes data and sends alerts.
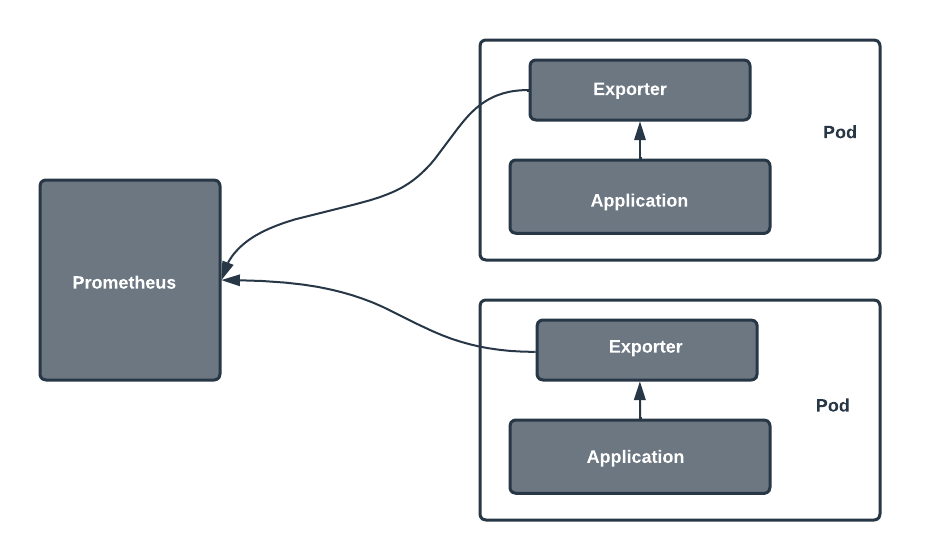
Internal Workflow
- Robot component (e.g., LiDAR sensor) → Exposes metrics via Exporter.
- Exporter translates data → Makes available on
/metrics. - Prometheus scrapes endpoint on schedule.
- Data stored in TSDB.
- Visualization + Alerts integrated with Grafana/Alertmanager.
Architecture Diagram (Textual)
[Robot Sensor/Actuator] → [Exporter] → /metrics → [Prometheus Server]
     → [TSDB] → [Grafana / Alertmanager / CI/CD Integration]
Integration Points with CI/CD or Cloud Tools
- CI/CD Pipelines: Metrics from robot simulations (e.g., Gazebo) exported for automated testing.
- Cloud Robotics Platforms (AWS RoboMaker, Azure IoT, GCP IoT Core) integrate exporters for remote monitoring.
- Containerized Deployments (Kubernetes): Exporters run as sidecar pods.
4. Installation & Getting Started
Basic Setup / Prerequisites
- Install Prometheus (≥ v2.0).
- Linux/Windows machine with Docker or Kubernetes.
- Exporter binary or container (e.g.,
node_exporter,robot_exporter).
Hands-On: Example with Node Exporter
- Download Node Exporter:
wget https://github.com/prometheus/node_exporter/releases/download/v1.8.0/node_exporter-1.8.0.linux-amd64.tar.gz tar xvf node_exporter-1.8.0.linux-amd64.tar.gz cd node_exporter-1.8.0.linux-amd642. Run Exporter:
./node_exporter Metrics exposed at: http://localhost:9100/metrics
3. Configure Prometheus (prometheus.yml):
scrape_configs: - job_name: 'robot_node' static_configs: - targets: ['localhost:9100']4. Start Prometheus:
./prometheus --config.file=prometheus.yml5. Verify in Browser:http://localhost:9090 → query metrics like node_cpu_seconds_total.
5. Real-World Use Cases
1. Autonomous Mobile Robots (AMRs)
- Exporters monitor battery health, CPU load, navigation accuracy.
- Alerts prevent robot downtime in warehouses.
2. Industrial Robots
- Exporters track arm motor temperature, joint stress, and cycle counts.
- Helps in predictive maintenance to avoid costly failures.
3. Drone Fleet Monitoring
- Exporters collect altitude, GPS accuracy, signal strength.
- Enables real-time monitoring in defense or delivery operations.
4. Healthcare Robots
- Exporters monitor sensor failures, AI inference performance in surgical robots.
- Ensures patient safety and compliance.
6. Benefits & Limitations
Key Advantages
- Standardized Monitoring: Unified
/metricsformat. - Extensibility: 100+ exporters available (Node, MySQL, Kafka, Custom robot exporters).
- Scalability: Works in distributed robot fleets.
- Integration: Native with Grafana, Alertmanager, Kubernetes.
Common Challenges
- Overhead: Exporters may consume CPU in resource-constrained robots.
- Limited Native Exporters: Custom exporters often needed for proprietary hardware.
- Network Reliability: Remote scraping in robots requires stable connectivity.
7. Best Practices & Recommendations
- Security:
- Use TLS and authentication on exporter endpoints.
- Restrict
/metricsexposure with firewalls.
- Performance:
- Avoid scraping too frequently (typical 15s–30s).
- Use pushgateway for short-lived robot jobs.
- Automation:
- Deploy exporters as sidecar containers in Kubernetes.
- Automate exporter installation via Ansible/Terraform.
- Compliance:
- Ensure GDPR/ISO safety compliance when monitoring sensitive robot data.
8. Comparison with Alternatives
| Tool/Approach | Pros | Cons | Use in RobotOps |
|---|---|---|---|
| Prometheus Exporters | Open-source, wide adoption, pull model | Needs custom exporters for robots | ✅ Best fit |
| StatsD / Telegraf | Lightweight, push model | Less standardized, fewer integrations | Possible alt. |
| OpenTelemetry Collectors | Vendor-neutral, integrates traces + logs | More complex setup | ✅ For advanced RobotOps |
| Custom Logging Scripts | Easy for simple robots | No standardized metrics format | ❌ Limited |
When to choose Prometheus Exporters:
- Standard Prometheus monitoring stack.
- Robots requiring long-term time-series analysis.
- Integration with Grafana + Alertmanager.
9. Conclusion
Prometheus Exporters are a critical building block for observability in RobotOps. They help bridge robotic hardware/software systems with Prometheus, enabling monitoring, anomaly detection, and predictive maintenance.
Future Trends
- AI-driven anomaly detection on exporter data.
- Exporters designed for ROS2 (Robot Operating System 2).
- Cloud-native robot observability stacks.
Next Steps
- Experiment with Node Exporter + Robot-specific exporters.
- Integrate with Grafana for dashboards.
- Explore official Prometheus docs: https://prometheus.io/docs
- Community: CNCF Slack, Prometheus GitHub discussions.