Introduction
Bringing robots into your factory or warehouse is an exciting step. When you first set them up, it feels like magic. The machines move fast, they do the heavy lifting, and they never ask for a coffee break. Many business owners think that buying the robot is the end of the hard work. They plug the machine into the wall, turn it on, and expect their business to grow automatically. However, just owning a robot is not enough to guarantee success. You need to know exactly how well that robot is working every single day.
This is where measuring your robot’s performance becomes incredibly important. Think of it like owning a sports car; you cannot just drive it forever without checking the gas, the oil, or the speed. To truly get the best out of your machines and save money, you need to track their numbers. For business owners who want to set up the right tracking, learning from expert platforms like Robotsops.com can help you understand your robots better. Tracking these numbers is the real secret to making your robotic systems profitable.
The Danger of “Flying Blind” with Automation
Imagine driving down a dark highway at night in a car with a completely broken dashboard. You cannot see how fast you are going, you have no idea if your engine is overheating, and your gas gauge is totally blank. You might feel like you are making good time, but in reality, you could run out of gas or blow your engine at any moment. This is exactly what it is like when factory owners use robots without tracking their performance data. They are simply flying blind and hoping for the best.
Many warehouse managers fall into this exact trap. They walk across the factory floor, hear the robots humming, see the metal arms moving, and assume everything is perfect. What they do not see are the hidden problems. A robot might be pausing for ten seconds every few minutes because of a software glitch. Over a whole month, those little ten-second pauses can add up to hundreds of hours of lost work. Because no one is watching the dashboard, the manager has no idea why the factory is making fewer products this month.
When you do not measure how your robots are working, you silently lose millions of dollars. Robots might be breaking down slowly without making a sound, or they might be working much slower than they were built to work. Sometimes, a robot might be picking up the wrong items or dropping them, ruining the products. If nobody is tracking the errors, the broken products get thrown in the trash, and the company’s money goes right in the trash with them.
The biggest difference between a struggling manager and a highly successful manager is data. The stressed manager is always guessing why the robots stopped working and yelling at the mechanics to fix things in a panic. The smart manager looks at a simple computer screen, sees that a robot is slowing down, and fixes the small problem before the machine completely breaks. Tracking your robot’s numbers turns you from a person who guesses into a person who knows exactly what is happening in your business.
The Core KPIs Every Manager Must Track
Before we look at the exact numbers, it helps to remember what a KPI really is. Key Performance Indicators are just the vital signs of your business, much like a heartbeat or blood pressure reading at the doctor’s office. You do not need to be a math genius or an engineer to understand them. Here are the main scores you should be looking at every day.
Uptime and Availability (Is it working?)
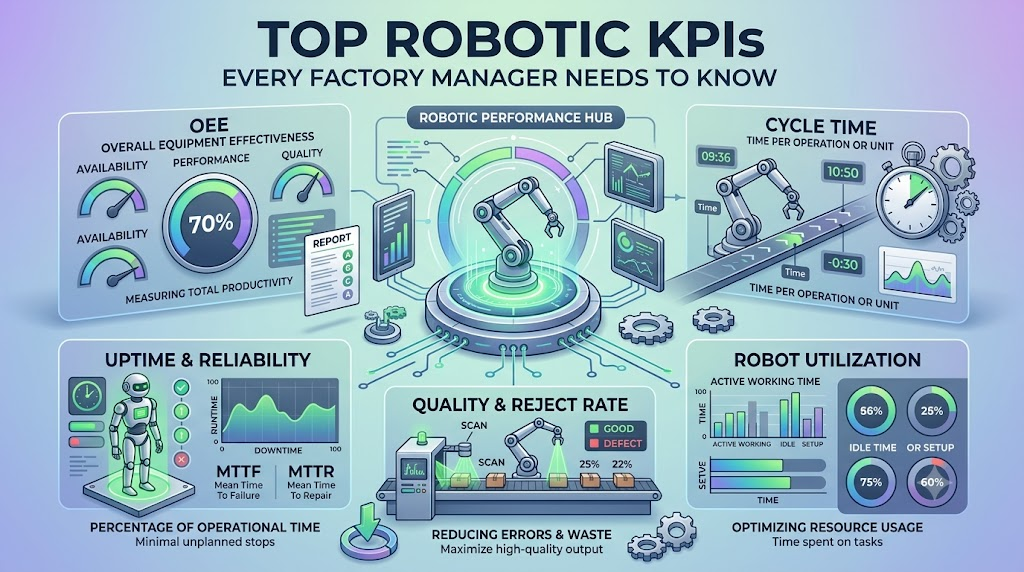
Uptime is the most basic and important number you can track. In very simple terms, it asks: “Is the robot turned on and doing its job right now?” If your factory is open for ten hours a day, you want your robot working for those full ten hours. Uptime is the percentage of time your robot is awake and working, compared to the time it spends broken or stopped.
You cannot make money if your robot is sitting perfectly still. Even if you buy the fastest, most expensive robot in the world, it is completely useless if it breaks down every two hours. A high uptime score means your robot is reliable and ready to work. A low uptime score tells you that your machine is sick, waiting for parts, or constantly getting stuck.
Keeping track of this number helps managers ask the right questions. If a robot is only working 60% of the day, the manager can step in and find out why. Is the battery dying too fast? Are the workers forgetting to turn it on? Does it need fresh oil? Measuring uptime is the first step to making sure your expensive machine is actually earning its keep.
Cycle Time (Is it fast?)
Once you know the robot is awake and working, the next question is: “How fast is it doing its job?” This is called Cycle Time. Cycle Time is the exact amount of time it takes a robot to finish one single task from start to finish. For example, if a robot’s job is to pick up an apple and put it in a box, the cycle time is how many seconds it takes to grab the apple, move it, and drop it in the box safely.
Speed is how factories make money. If a robot can pack one box every five seconds, you know exactly how many boxes you will have ready to sell by the end of the day. If that cycle time suddenly changes from five seconds to eight seconds, you have a big problem. The robot is still working, so it will not trigger an alarm, but it is moving sluggishly. You are now making fewer boxes, which means you are making less money.
By tracking the speed of every task, a manager can see if a machine is getting old and tired. Sometimes, the fix is very simple. The robot might just need its joints cleaned, or the software might need a small update to make it move smoother. When you watch the cycle time closely, you guarantee that your business stays fast and keeps up with your customer’s orders.
Error Rate (Is it making mistakes?)
A robot that works fast and never stops sounds great, but what if it keeps doing the job poorly? This is where the Error Rate comes in. Error Rate asks the question: “How many mistakes is this machine making?” If a robot paints car doors, the error rate counts how many doors get painted beautifully versus how many doors get scratched or missed.
Quality is just as important as speed. If your machine builds one hundred toys an hour, but fifty of those toys have missing wheels, your robot is actually hurting your business. You are wasting raw materials, and you have to pay human workers extra money to fix the robot’s messy mistakes. High error rates are a massive red flag that something is out of balance.
Tracking this score tells you exactly when a machine needs tuning. Maybe the robot’s metal fingers are worn out and slipping, or maybe its camera lens is dirty and it cannot see what it is grabbing. By catching these mistakes early, you stop bad products from reaching your customers, keeping your buyers happy and your brand strong.
Overall Equipment Effectiveness (OEE)
You can think of Overall Equipment Effectiveness (OEE) as a final report card for your machine. It takes the three main things we just talked about—how often it is working (Uptime), how fast it moves (Cycle Time), and how good the work is (Error Rate)—and rolls them into one master grade.
If your robot gets a high score on its OEE report card, it means your factory is running like a dream. The machines are awake, fast, and perfect. If the score is low, the manager knows immediately that they need to step in and find out which of the three areas is causing the failure. It is the ultimate number that tells you if your robot is a good employee.
Comparing a Data-Driven Robot Fleet vs. Unmanaged Robots
To really see why this matters, let us look at what happens to two different companies. Company A checks its numbers every single day. Company B just turns their machines on and hopes for the best.
| Feature to Compare | Company A (Tracks KPIs / Data-Driven) | Company B (Unmanaged Robots) |
| Maintenance Costs | Very low. They fix tiny things before they break totally. | Very high. Machines run until they completely blow up. |
| Output / Productivity | High and steady. They know exactly how much they can make. | Unpredictable. Some days are good, some days are terrible. |
| Ability to Find Problems | Instant. A screen shows them a warning immediately. | Slow. They only find out when products stop coming out. |
As you can see in the table above, Company A runs a smooth, stress-free business. Because they track their robot’s numbers, they are always one step ahead of a disaster. They spend far less money fixing machines because they add oil or change parts long before the machine snaps in half. Their workers are happy, and their output is incredibly steady.
Company B, on the other hand, lives in a state of constant panic. Because they do not look at any numbers, they never know when a robot is going to die. A machine will completely break down in the middle of a busy shift, stopping all the other machines on the floor. They have to pay for emergency repairs, which cost a fortune, and they miss their delivery deadlines to their buyers.
By simply choosing to track basic scores, you move from being a victim of bad luck to a master of your own business. The numbers act like a shield, protecting your factory from surprise costs and keeping your production line moving perfectly day after day.
How to Actually Measure These Numbers in Real-Time
You might be wondering how you actually get these numbers. Do you have to stand next to the robot with a clipboard and a stopwatch all day? Thankfully, the answer is no. Modern technology does all the hard work for you. Today, robots are built with smart computer brains that automatically count everything they do. They know when they wake up, how fast they move, and when they drop an item.
All of this information is sent instantly to a software dashboard on a computer. A dashboard is just a screen that organizes the numbers into pretty colors and simple charts. Most of these screens use colors like a traffic light to help you understand the factory floor in one quick glance. A green light on the screen means the robot is doing perfectly. A yellow light means it is moving a little slow and needs a checkup. A red light means the robot has stopped completely and needs help right now.
The best part is that you do not even need to be in the same building as the robots to see these numbers. Because these dashboards live on the internet, a factory manager can look at the scores on their mobile phone while they are drinking coffee at home. If a robot gets stuck in the middle of the night, the software can automatically send a text message to the night shift mechanic telling them exactly which machine is stuck.
This real-time measuring removes all the guesswork from running a factory. You do not have to wait until the end of the month to count how many boxes you made. You can look at your computer at noon and know exactly how your business is doing that very second. It makes managing a huge factory floor as easy as playing a simple video game.
Using Data to Build a Better Future
Having all these numbers on a screen is wonderful, but data is totally useless if you do not do anything with it. The best managers use these scores to plan a brighter, more profitable future for their business. One of the best things you can do with this information is something called predictive maintenance. This simply means fixing a machine before it actually breaks. If your dashboard shows that a robot gets slower every Friday, you can plan to clean it on Thursday night. This stops the breakdown from ever happening at all.
These numbers also help you make really smart choices when it is time to spend money. Imagine you want to buy a second robot to help your business grow. Instead of guessing which brand to buy, you can look at the historical scores of the robot you already own. If your current machine constantly has a low uptime score and breaks a lot, you know you should buy a different brand next time. The numbers protect your wallet from bad purchases.
Finally, these scores are a fantastic tool for training your human staff. Sometimes, a robot stops working not because the machine is bad, but because a human worker fed the materials into it incorrectly. By looking at the error rates, a manager can see which shift is making the most mistakes. They can then calmly teach the workers how to load the machine properly.
When you use your robot’s daily grades to plan ahead, you stop fighting daily fires. You move your business forward, building a workplace that is safe, smart, and ready to handle any customer order that comes your way.
FAQs
1. What is a KPI?
A KPI stands for Key Performance Indicator. It is simply a score or a grade that helps you measure if your machine or business is doing a good job.
2. Why is tracking my robot important?
Tracking helps you see if your robot is working fast and making good products. Without tracking, your machine could be broken or wasting money without you even knowing it.
3. What does Uptime mean?
Uptime is the amount of time your robot is actually turned on and doing its job, compared to the time it sits broken or waiting for help.
4. How is Cycle Time different from Uptime?
Uptime measures if the robot is awake, while Cycle Time measures exactly how many seconds it takes the robot to finish one single task.
5. What is an Error Rate?
Error Rate is the number of mistakes a robot makes. It counts how many products the robot drops, scratches, or builds incorrectly.
6. Do I need to be a math expert to track these numbers?
Not at all! Modern software does all the counting for you and shows you simple charts with easy-to-read green, yellow, and red lights.
7. Can I see my robot’s scores on my phone?
Yes. Most modern tracking software connects to the internet, allowing you to check on your machines from a phone or tablet anywhere you are.
8. What does OEE stand for?
OEE stands for Overall Equipment Effectiveness. It is basically a master report card that combines speed, quality, and working time into one single grade.
9. How does tracking numbers save me money?
By watching the numbers, you can fix small problems before they cause the machine to break down completely, saving you from huge repair bills and lost work days.
10. What should I do if my robot’s scores are low?
If the scores drop, you should look at the dashboard to see where the problem is. You might need to clean the machine, update its software, or train your workers to use it better.
Conclusion
Owning a robot is a fantastic way to make your business faster and stronger, but the machine itself is only half of the puzzle. The true magic happens when you understand how your machine is working on a daily basis. Measuring your robotic scores does not have to be a scary or confusing task reserved for rocket scientists. It is simply about asking if your machine is awake, if it is fast, and if it is doing a good job.
By paying attention to simple scores like Uptime, Cycle Time, and Error Rate, you protect your money and keep your business running smoothly. You catch tiny problems before they turn into expensive nightmares, and you stop guessing about how your factory is doing. Tracking your robots is the smartest, simplest way to guarantee that your investment pays off for many years to come.
