1. Introduction & Overview
What is Log Aggregation?
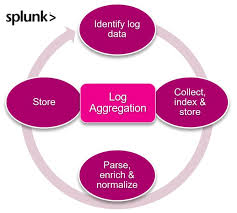
Log aggregation is the process of collecting, centralizing, and organizing logs generated from multiple distributed systems, robots, or applications into a single repository for monitoring, analysis, and troubleshooting. In the context of RobotOps (Robotic Operations), it ensures seamless visibility across robotic fleets, controllers, edge devices, and cloud-based orchestration systems.
Instead of engineers manually checking logs on each robot, log aggregation consolidates them into a single platform such as ELK Stack (Elasticsearch, Logstash, Kibana), Fluentd, or Grafana Loki, enabling fast debugging, predictive maintenance, and anomaly detection.
History / Background
- Pre-2010s – Logs were stored locally in files (syslog, text files) with limited correlation.
- 2010–2015 – Rise of centralized logging frameworks (ELK, Splunk) with cloud integration.
- 2016–present – With Kubernetes, cloud robotics, and IoT, distributed log aggregation became a necessity.
- RobotOps today – Autonomous robots generate large volumes of telemetry, sensor, and operational logs. Log aggregation is critical for fleet observability and compliance.
Why is it Relevant in RobotOps?
Robotic systems are highly distributed and event-driven. Without log aggregation:
- Debugging is slow (engineers must SSH into robots individually).
- Data loss occurs if a robot crashes.
- Root cause analysis of failures is difficult.
With log aggregation, RobotOps teams gain:
- Centralized observability – Fleet-wide monitoring.
- Incident response – Faster debugging with correlated logs.
- Predictive analytics – Early detection of hardware/software issues.
- Compliance – Securely storing operational logs for audits (e.g., ISO, GDPR).
2. Core Concepts & Terminology
| Term | Definition |
|---|---|
| Log Stream | Continuous flow of log messages generated by robotic processes. |
| Collector/Agent | A lightweight service (e.g., Fluent Bit, Filebeat) running on robots to send logs to a central system. |
| Parser | Transforms raw log lines into structured data (JSON, key-value). |
| Indexing | Organizing logs for efficient searching (Elasticsearch, OpenSearch). |
| Visualization | Graphical dashboards (Grafana/Kibana) for monitoring trends. |
| Retention Policy | Rules for storing, archiving, or deleting logs after certain time. |
How It Fits into the RobotOps Lifecycle
- Development – Debugging robot behaviors during testing.
- CI/CD Deployment – Capturing logs from robotic simulation environments.
- Operations – Monitoring production robots in real-time.
- Maintenance – Detecting recurring faults or anomalies.
- Compliance & Audit – Retaining logs for security or legal requirements.
3. Architecture & How It Works
Components in Log Aggregation
- Log Producers – Robots, controllers, IoT sensors, cloud APIs.
- Log Collectors/Forwarders – Filebeat, Fluent Bit, rsyslog agents on edge devices.
- Transport Layer – Kafka, MQTT, or direct HTTP for transmitting logs.
- Processing & Parsing – Tools like Logstash or Fluentd.
- Central Storage & Indexing – Elasticsearch, OpenSearch, or Loki.
- Visualization – Grafana/Kibana dashboards.
- Alerting & Automation – PagerDuty, Prometheus Alertmanager.
Internal Workflow
- Robot generates logs (navigation, sensors, errors).
- Local collector agent picks logs and forwards to pipeline.
- Logs pass through parsing/formatting stage.
- Central indexer stores structured logs.
- Operators visualize and query logs on dashboards.
- Alerts trigger if error thresholds are breached.
Architecture Diagram (Textual Description)
   [Robot / Edge Device] --> [Collector Agent (Fluent Bit/Filebeat)]
       --> [Transport Layer (Kafka/MQTT/HTTP)]
           --> [Log Processor (Logstash/Fluentd)]
               --> [Central Storage (Elasticsearch/OpenSearch)]
                   --> [Visualization (Grafana/Kibana)]
                       --> [Alerts / Notifications / CI/CD Integration]
Integration with CI/CD & Cloud Tools
- CI/CD: Logs from simulation test jobs (ROS, Gazebo) are aggregated for debugging.
- Cloud: AWS CloudWatch, GCP Logging, or Azure Monitor can store and analyze robot logs.
- Kubernetes: Sidecar log collectors aggregate pod logs from robotic microservices.
4. Installation & Getting Started
Prerequisites
- Linux-based environment (Ubuntu or CentOS).
- Docker installed (optional for ELK stack).
- At least one robot or simulator (ROS-based).
Step-by-Step Setup: ELK Stack with Filebeat
1. Install Elasticsearch
docker run -d --name elasticsearch -p 9200:9200 \
  -e "discovery.type=single-node" docker.elastic.co/elasticsearch/elasticsearch:8.15.0
2. Install Kibana
docker run -d --name kibana -p 5601:5601 \
  --link elasticsearch:elasticsearch docker.elastic.co/kibana/kibana:8.15.0
3. Install Filebeat on Robot
sudo apt-get install filebeat
sudo nano /etc/filebeat/filebeat.yml
Configure output to Elasticsearch:
output.elasticsearch:
  hosts: ["localhost:9200"]
4. Start Filebeat
sudo systemctl enable filebeat
sudo systemctl start filebeat
5. Visualize Logs in Kibana
- Open
http://localhost:5601→ Discover → View logs from your robot.
5. Real-World Use Cases
Use Case 1 – Fleet Monitoring
Aggregating logs from 100+ delivery robots in a city to detect navigation errors and battery issues.
Use Case 2 – Predictive Maintenance
Analyzing motor error logs from industrial robots to forecast hardware failures before downtime occurs.
Use Case 3 – Simulation Debugging
During CI/CD simulation (ROS + Gazebo), logs are aggregated for faster identification of navigation or SLAM bugs.
Use Case 4 – Security Auditing
Centralizing security logs (access, authentication attempts) from autonomous drones to ensure compliance with aviation safety.
6. Benefits & Limitations
Key Advantages
- Single-pane view of logs from all robots.
- Faster root-cause analysis.
- Scalability with distributed systems.
- Enhanced compliance and audit readiness.
Limitations
- High storage requirements for large fleets.
- Complexity in setup (requires multiple components).
- Network bandwidth concerns for real-time log streaming.
- Parsing challenges due to unstructured robot logs.
7. Best Practices & Recommendations
- Security: Encrypt logs in transit (TLS) and at rest.
- Performance: Use lightweight forwarders (Fluent Bit) for edge devices.
- Retention Policies: Archive old logs to cold storage (S3, Glacier).
- Compliance: Align with ISO 10218 (robot safety) and GDPR.
- Automation: Integrate alerts with PagerDuty/Slack for real-time notifications.
8. Comparison with Alternatives
| Approach | Pros | Cons | Best Use Case |
|---|---|---|---|
| ELK Stack | Rich ecosystem, visualization | Heavy resource usage | Enterprise RobotOps |
| Fluentd + Loki | Lightweight, Kubernetes-native | Limited full-text search | Cloud-native fleets |
| Splunk | Enterprise-grade analytics | Expensive | Large regulated industries |
| Cloud-native (AWS/GCP) | Managed service, less ops overhead | Vendor lock-in | Startups using single cloud |
9. Conclusion
Log aggregation is a cornerstone of RobotOps, enabling operators to maintain visibility, ensure compliance, and optimize robotic performance. With tools like ELK, Fluentd, and Loki, RobotOps teams can centralize logs from fleets, perform advanced analytics, and reduce MTTR (Mean Time to Recovery).
Future Trends
- AI/ML-driven anomaly detection in logs.
- Edge log processing to reduce bandwidth usage.
- Cross-fleet correlation for swarm robotics.
Next Steps
- Deploy a small ELK/Loki stack with one robot.
- Expand to fleet-wide aggregation.
- Automate alerting with CI/CD pipelines.
References & Communities
- Elastic Stack Docs
- Fluentd Docs
- Grafana Loki
- ROS Logging
