1. Introduction & Overview
What are Prometheus Exporters?
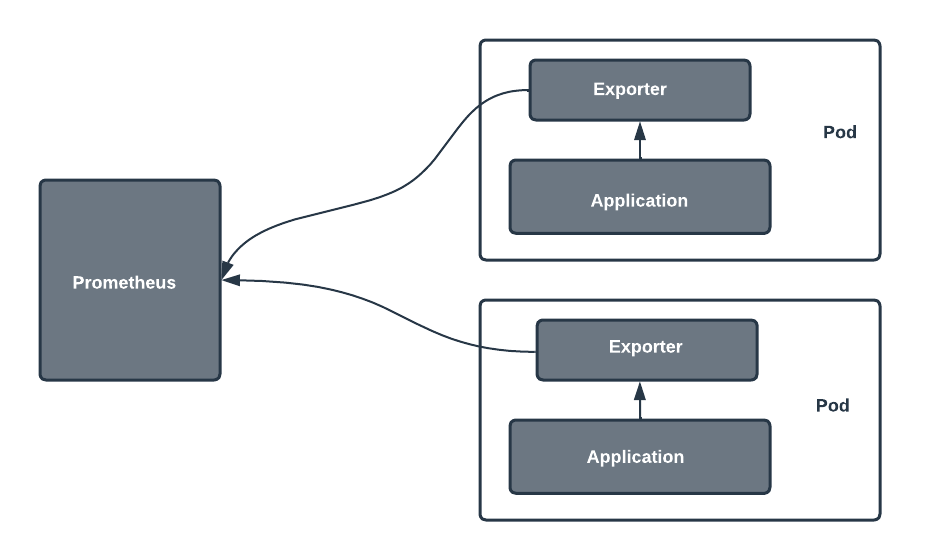
Prometheus Exporters are components that expose metrics from third-party systems in a format that Prometheus can scrape. Since Prometheus natively collects metrics via HTTP endpoints, exporters bridge the gap by translating internal or external metrics into a Prometheus-compatible format.
Example: Node Exporter exposes system-level metrics like CPU, memory, disk usage for Prometheus to collect.
Background
Prometheus, created by SoundCloud in 2012 and now part of the Cloud Native Computing Foundation (CNCF), revolutionized open-source monitoring. Exporters emerged as a modular way to collect metrics from systems not instrumented with Prometheus client libraries.
Why is it Relevant in DevSecOps?
In a DevSecOps pipeline, visibility into the health, performance, and security of systems is critical. Prometheus Exporters help:
- Provide security insights (e.g., firewall, authentication logs)
- Enable performance baselining during CI/CD
- Detect anomalies or intrusions early via metrics
- Feed data into SIEM, alerting, and auto-remediation pipelines
2. Core Concepts & Terminology
Key Terms and Definitions
| Term | Definition |
|---|---|
| Exporter | A service that collects and exposes metrics in a Prometheus-compatible format |
| Scraping | Pulling metrics from endpoints by Prometheus at defined intervals |
| Time-series data | Data points indexed by time, used by Prometheus to track metric changes |
| Labels | Key-value pairs attached to metrics for filtering and aggregation |
| Target | A system or service monitored via an exporter |
How It Fits Into the DevSecOps Lifecycle
| Phase | Role of Prometheus Exporters |
|---|---|
| Develop | Track resource usage during build tests (Node Exporter, Jenkins Exporter) |
| Secure | Monitor access logs, firewall metrics, container scans |
| Operate | Track uptime, performance, and error rates |
| Audit | Retain metrics for compliance or security review |
3. Architecture & How It Works
Components
- Prometheus Server: Main component that scrapes and stores metrics
- Exporter: Provides
/metricsendpoint for Prometheus - Alertmanager: Sends alerts based on Prometheus rules
- Dashboard (e.g., Grafana): Visualizes metrics data
Internal Workflow
- Exporter exposes metrics at
http://localhost:port/metrics - Prometheus scrapes metrics periodically
- Rules in Prometheus generate alerts
- Data sent to Grafana, Alertmanager, or third-party tools
Architecture Diagram (Descriptive)
[ System / App ]
      |
[ Prometheus Exporter ]
      |
[ /metrics endpoint ]
      |
[ Prometheus Server ]
      |     |
[ Alertmanager ]   [ Grafana ]
Integration Points
- CI/CD Tools: Jenkins Exporter, GitHub Actions workflows with Prometheus metrics
- Cloud Platforms: AWS CloudWatch Exporter, GCP Exporter
- Security Tools: Falco Exporter, Suricata Exporter for security events
- Container Platforms: kube-state-metrics, cAdvisor
4. Installation & Getting Started
Prerequisites
- Prometheus installed and running
- Exporter binary or Docker container
- Basic YAML editing for
prometheus.yml
Example: Installing Node Exporter
Step 1: Download and Run Node Exporter
wget https://github.com/prometheus/node_exporter/releases/latest/download/node_exporter-*.tar.gz
tar xvfz node_exporter-*.tar.gz
cd node_exporter-*
./node_exporter
Or use Docker:
docker run -d -p 9100:9100 prom/node-exporter
Step 2: Update prometheus.yml
scrape_configs:
  - job_name: 'node_exporter'
    static_configs:
      - targets: ['localhost:9100']
Step 3: Reload Prometheus Config
curl -X POST http://localhost:9090/-/reload
Step 4: Verify
Visit http://localhost:9100/metrics or http://localhost:9090/targets to confirm.
5. Real-World Use Cases
1. CI Pipeline Observability (Jenkins Exporter)
- Metrics on job durations, failures, and queue length
- Enable alerting if test jobs fail frequently
2. Security Monitoring (Falco Exporter)
- Capture abnormal container behavior
- Feed metrics into Prometheus + Alertmanager
3. Cloud Cost Monitoring (AWS Exporter)
- Pull metrics from AWS CloudWatch
- Monitor usage spikes, failed login attempts
4. Infrastructure Health (Node Exporter + Disk Alerts)
- Proactive monitoring of disk space
- Alerting integrated with PagerDuty or Slack
6. Benefits & Limitations
Key Advantages
- Modularity: Plug-and-play for various systems
- Open Source: Large ecosystem and community support
- Custom Exporters: Build one for your internal tools
- Security & Compliance: Monitor sensitive activity
Common Challenges
| Challenge | Description |
|---|---|
| Scraping Overhead | Too many exporters can increase Prometheus load |
| No Native Push Model | Requires Prometheus to poll regularly |
| Exporter Quality | Community exporters vary in maturity |
| Security Risks | Unsecured metrics endpoints can leak system information |
7. Best Practices & Recommendations
Security
- Use TLS and Basic Auth for exporter endpoints
- Restrict access via firewalls or reverse proxies
- Sanitize sensitive data in custom exporters
Performance
- Avoid over-scraping (use
scrape_interval) - Aggregate high-cardinality metrics
Maintenance
- Use service discovery (e.g., Kubernetes)
- Version-lock exporters and update regularly
Compliance & Automation
- Tag metrics with labels like
env,team,service - Integrate with compliance dashboards (e.g., Splunk, ELK)
8. Comparison with Alternatives
| Tool/Approach | Pros | Cons |
|---|---|---|
| Prometheus Exporters | Lightweight, customizable, DevSecOps-friendly | Requires separate exporters per system |
| Telegraf (InfluxDB) | Unified agent, push model | Heavier setup, less DevSecOps-native |
| Datadog Agent | Easy to use, built-in dashboards | Commercial, costlier |
| Elastic Beats | Integrated with ELK stack | Not Prometheus-native, higher complexity |
When to Choose Prometheus Exporters
- When using Prometheus/Grafana stack
- When you need modular, open-source observability
- When full control and security over metrics are required
9. Conclusion
Prometheus Exporters are indispensable tools in the DevSecOps lifecycle. They enable observability, security, and operational intelligence by exposing meaningful metrics from any system. Their modularity, extensibility, and open-source foundation make them an ideal fit for modern, cloud-native environments.
Next Steps
- Explore the Prometheus Exporters repository
- Build a custom exporter for internal security tools
- Integrate exporter metrics into your DevSecOps dashboards